Personal project · Data pipeline · May — June 2025
Warstock
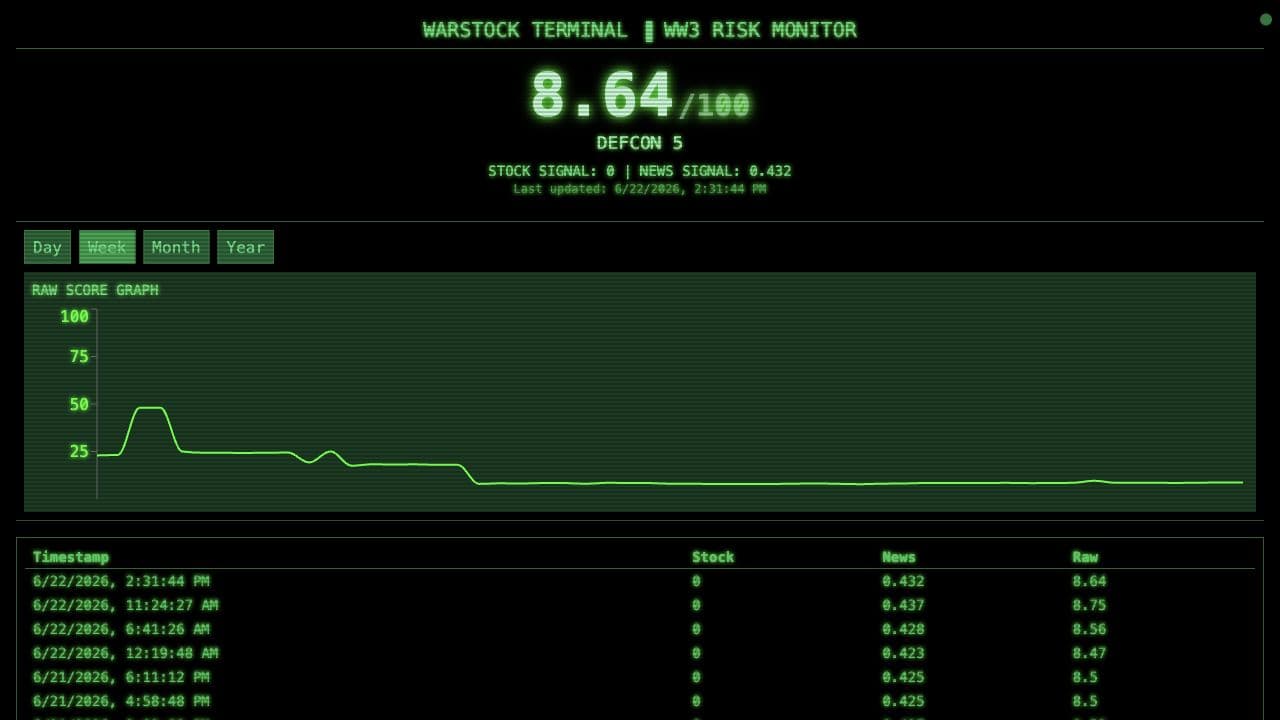
An hourly risk monitor that combines defense-market movement and conflict news into a transparent, inspectable score.
Why it exists
Warstock is an experimental terminal that watches defense-related market activity and Google News RSS feeds, then publishes an hourly historical risk score with its raw components visible.
- Role
- Design + engineering
- Timeline
- May — June 2025
- Stack
- React · JavaScript · GitHub Actions · RSS · Recharts
The problem
News-driven risk dashboards often hide their reasoning. I wanted to explore a small scoring system where visitors could inspect both the inputs and the weighting instead of receiving an unexplained prediction.
My ownership
- Built the live application, automated collection pipeline, scoring model, historical views, and retro terminal interface.
- Integrated five defense-related stocks and three Google News RSS feeds.
- Created an hourly GitHub Actions workflow to refresh data and run the model.
Technical decisions
- Kept the score deliberately simple: 80% stock signal and 20% news signal, normalized to 100.
- Made component scores and history visible so changes could be traced rather than treated as a black box.
- Used 44 keyword signals across military conflict, defense systems, and drone-strike feeds for reproducible news scoring.
Results
- Maintains an hourly dataset and interactive history across day, week, month, and year views.
- Exposes raw stock, news, and combined scores alongside exportable history.
- Demonstrates scheduled data ingestion, scoring, persistence, visualization, and deployment in one system.